Employee lifecycle management represents a strategic framework that oversees an individual’s journey from attraction through advocacy.
By integrating data at every stage—from sourcing and recruitment to onboarding, retention, development, offboarding, and alumni engagement—organisations gain end-to-end visibility into workforce dynamics.
This unified approach ensures alignment between talent initiatives and business objectives, driving productivity, engagement, and cost efficiencies.
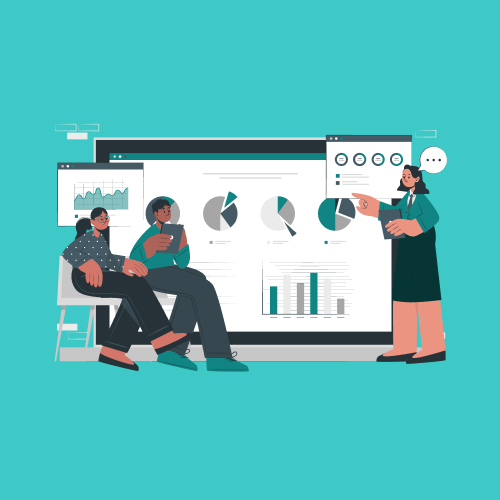
Analytics plays a central role in transforming HR processes. Advanced dashboards and predictive models within solutions like MiHCM Data & AI enable HR leaders to identify patterns in candidate pipelines, measure onboarding success, forecast flight risks, and personalise development paths. With real-time insights, teams can shift from reactive troubleshooting to proactive interventions.
This guide sets expectations for an analytics-driven employee lifecycle management framework. Readers will explore:
- The seven core lifecycle stages and their impact on employee experience
- Critical metrics and analytics tools for each phase
- Best practices for integrating data pipelines, governance, and dashboards
- Steps to measure ROI and select the right platforms
By the end, HR leaders and people-analytics professionals will have a clear roadmap for optimising every touchpoint of the employee lifecycle, driving stronger engagement, retention, and advocacy.
Key takeaways
- Employee lifecycle management connects all HR phases—from attraction to advocacy—offering a holistic view of talent flow.
- Embedding analytics at each stage enables proactive, data-driven decision making and targeted interventions.
- The seven lifecycle stages—Attraction, Recruitment, Onboarding, Retention, Development, Offboarding, Advocacy—map to specific metrics and dashboards.
- MiHCM suite provides unified modules (Lite, Enterprise, MiA, Analytics, Data & AI, SmartAssist) for end-to-end measurement and predictive insights.
The 7 stages of the employee lifecycle

- Attraction: Sourcing analytics measure channel effectiveness and employer brand engagement.
- Recruitment: Candidate funnel metrics reveal conversion rates from application to hire.
- Onboarding: Engagement and performance indicators track time to productivity and satisfaction.
- Retention: Predictive turnover models identify flight risks and tenure distributions.
- Development: Performance and skill analytics assess competency growth and training ROI.
- Offboarding: Exit interview analytics categorise departure reasons and process compliance.
- Advocacy: Alumni metrics gauge referral activity, eNPS, and employer brand promotion.
Each stage influences employee experience and organisational outcomes. By overlaying analytics, HR teams can detect trends, uncover root causes, and implement data-driven improvements—elevating engagement and reducing costs.
Stage 1: Attraction – Sourcing Analytics
At the Attraction stage, talent acquisition analytics assess the performance of sourcing channels and employer branding initiatives. Key metrics include time to source, candidate quality scores, and cost per hire. Predictive sourcing models forecast pipeline health, while career page analytics reveal engagement patterns.
MiHCM modules provide real-time dashboards that track channel ROI and candidate demographics, enabling recruiters to optimise budget allocation and refine targeting strategies.
Stage 2: Recruitment – Candidate Funnel Metrics
During Recruitment, candidate funnel metrics highlight conversion rates at each step—from application to offer acceptance. Monitor application-to-interview ratios, interview-to-offer rates, and drop-off points with recruitment CRM integrations.
- Yield ratio: candidates moving between stages
- Offer acceptance rate: quality of offers and market competitiveness
Visualisation in MiHCM Analytics uncovers bottlenecks, guiding process improvements and reducing time to fill.
Stage 3: Onboarding – Engagement and Performance Metrics
Effective onboarding accelerates time to productivity and secures early engagement. Track completion rates of orientation tasks, set performance milestones at days 30, 60, and 90, and measure new-hire NPS and pulse survey scores.
- Onboarding completion rate
- Time to productivity
- New hire eNPS
MiHCM Onboarding and Employee Self-Service streamline task management, while Analytics dashboards correlate feedback with retention projections to refine onboarding experiences.
Stage 4: Retention – Predicting Turnover and Retention Analytics
Retention analytics leverage predictive models to score flight risk and monitor turnover metrics such as voluntary departure rate and tenure distribution by segment. Early-warning dashboards flag at-risk employees, enabling targeted interventions by managers.
- Flight risk score
- อัตราการลาออก
- At-risk segment analysis
MiHCM Data & AI integrates NLP analysis of engagement surveys and performance data to recommend personalised retention plans.
Stage 5: Development – Performance and Skill Analytics
Development analytics measure performance against objectives, competency assessments, and training ROI. Track completion rates of learning programs and monitor skill gap closure over time.
- Objective achievement rate
- Competency score trends
- Training ROI
SmartAssist uses AI to suggest personalised learning paths, linking development metrics to internal mobility and succession outcomes within the MiHCM suite.
Stage 6: Offboarding – Exit Interviews and Alumni Engagement
Offboarding analytics capture exit interview feedback, categorise departure reasons, and measure process efficiency metrics such as offboarding completion rate and compliance checkpoints.
- Exit categorisation trends
- Offboarding process turnaround
- Alumni engagement rate
Alumni portals within MiHCM enable ongoing brand advocacy tracking—referrals, rehiring potential, and community activity—to inform retention strategies for current employees.
Stage 7: Advocacy – Alumni and Employee Advocacy Metrics
Advocacy metrics evaluate brand promotion by former and current employees. Key indicators include alumni eNPS, referral submission counts, social media shares, and brand ambassador participation.
- Alumni eNPS
- Referral conversion rate
- Brand ambassador activity
Data from MiHCM portals helps talent teams forecast passive candidate pipelines and amplify employer branding through engaged advocates.
Building an employee lifecycle management framework

- Data Integration: Consolidate HR, ATS, LMS, and performance data in a central warehouse.
- Governance: Establish data ownership, quality standards, and privacy controls.
- Dashboards: Deploy role-based, self-service analytics for HR, managers, and executives.
- Governance: Define policies for data access, retention, and compliance.
- Review Cycles: Schedule quarterly reviews to update metrics, refine models, and drive continuous improvement.
Best practices for analytics integration
- Adopt standardised data models and clean data pipelines to ensure consistency.
- Implement real-time dashboards and enable self-service analytics to democratise insights.
- Ensure data privacy through role-based access and GDPR/CCPA compliance controls.
- Foster data literacy across HR and leadership through training and documentation.
How to measure success and ROI of employee lifecycle management
Calculate ROI by quantifying cost savings from reduced turnover and time-to-fill improvements. Track key outcomes—improved retention, faster ramp-up, and higher engagement scores—against baseline metrics.
- Turnover cost savings
- Time-to-productivity reduction
- Engagement score uplift
Visualise ROI trends in MiHCM Analytics dashboards and share impact stories with stakeholders to secure ongoing investment.
Choosing the right tools and dashboards
- Evaluate platforms for end-to-end coverage across attraction, retention, and offboarding.
- Compare features: predictive analytics, self-service, mobile access, and AI-driven recommendations.
- Assess vendor support, implementation timeline, and compliance certifications (ISO, SOC 2).
- Plan for scalable deployment and integration with existing HRIS, ATS, and LMS systems.
Mastering employee lifecycle management with analytics

This guide reviewed the seven stages of the employee lifecycle and the analytics that drive proactive talent strategies. By leveraging the unified MiHCM suite, organisations can measure, analyse, and optimise each phase.
- Audit your current lifecycle data maturity.
- Pilot critical metrics with MiHCM modules.
- Scale across stages to elevate engagement and retention.


